Part 5. Reports
In the domain of finance, it is often necessary to make a report. Such a report, when made correctly, allows the retrieving the required information in an easy to understand form.
Reporting
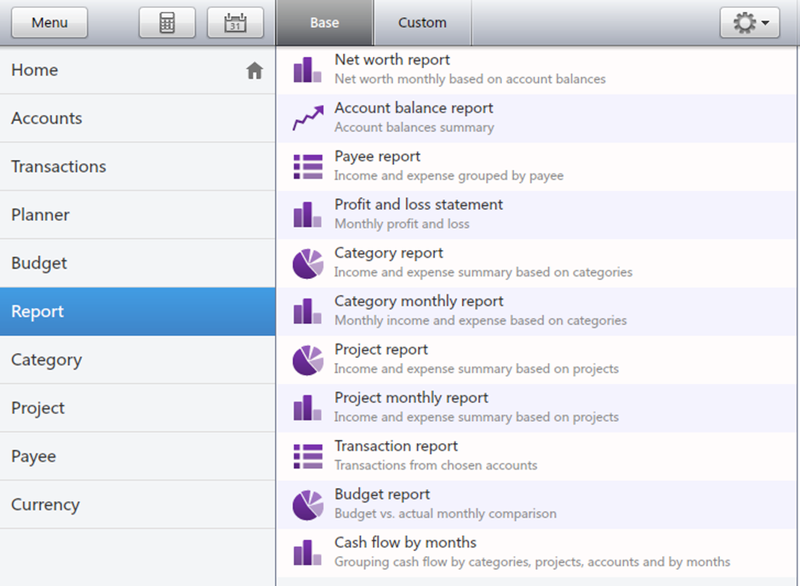
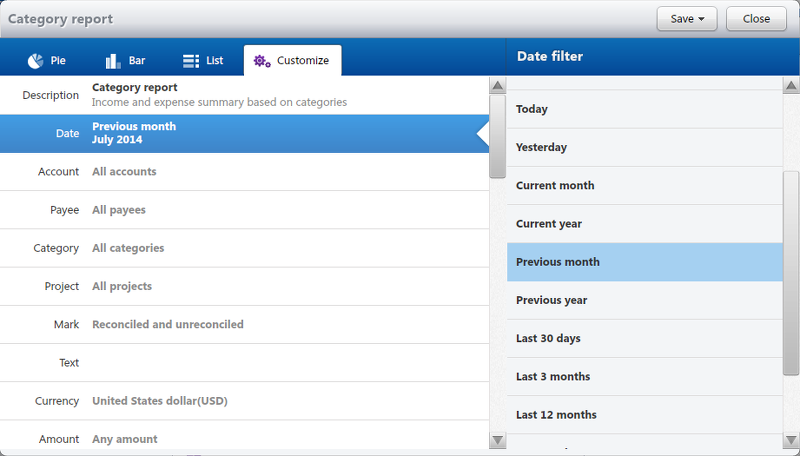
To make a report, select the Report tab. You will see a list of predefined report. Select report and double click to open it. Usage of a filter allows determining what transactions are to be considered while making a report. By selecting Accounts, Categories, Projects, Payees and other properties, you can indicate to what accounts, categories, projects and payees the transactions to be used in the report are related.
Selecting the report's form
Depending on what information is supposed to be presented in your report, you can select one of the report's forms:
- Net Worth is a net value report (financial term that means a total sum of all receipts, expenditures and the initial balance). Such a report allows you to follow changes of liquid value of your company etc. Usually it is presented in the form of a bar graph.
- Account Balances – this kind or report allows showing balance dynamics for each of the accounts selected by the filter and for all the accounts together.
- Payee report is a comparison between receipt and expenditure values by payee.
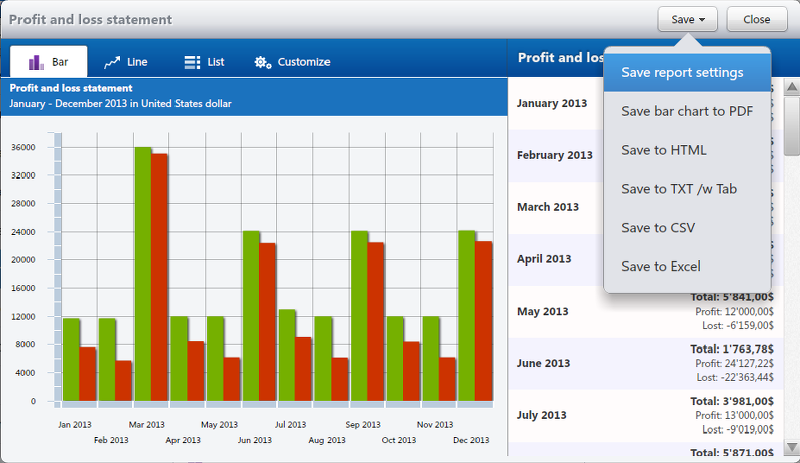
- Profit and Loss Statement report is a comparison between receipt and expenditure values.
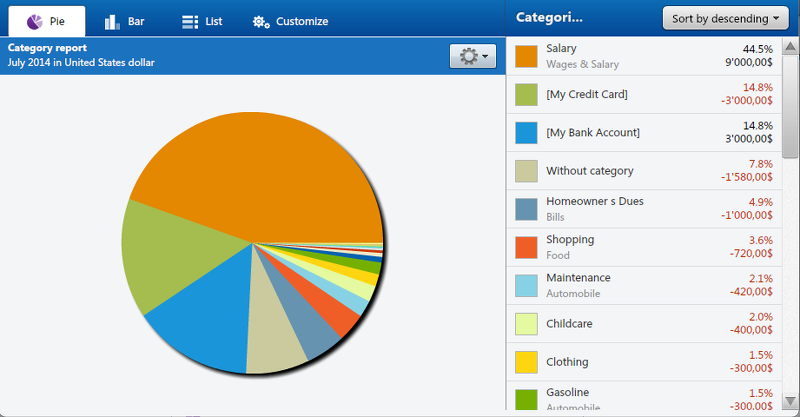
- Category is a report showing the distribution of receipts and expenditures among the categories.
- Montly Categories is a report showing monthly ratio of receipts and expenditures in all the categories selected by the filter.
- Project Report is a report showing distribution of receipts and expenditures between the projects.
- Monthly Project shows the ratio of receipts and expenditures in all the projects selected by the filter.
- Transaction Report is a list including all the transactions selected by the filter.
- Budget Monthly is a report showing the ratio of the scheduled and actual receipts and expenditures of the chosen budget.
- Cash flow by months. Grouping cash flow categories, projects, accounts and monthly
Presentation form for the report selection
Inesoft Cash Organizer allows choosing between four forms of presentation for the reports: text report, pie graph, bar graph and line graph. Whichever form you prefer, each report type has one which is the most typical default form. However, you can select other presentation forms for most of the reports.
Getting detailed information on the report's elements
While viewing the graphic report, you may need detailed information on some elements of the report (for example, amount of receipts or expenditures of the category in the report like "Income & Expense Category", account balance for the selected date in the report "Account Balances" etc.). You may get the required information by moving mouse over desired elements.
Create an auxiliary report
If necessary, you may get additional information on an element of the report not only in the form of a table, but also in the form of an auxiliary report. For such purpose, select the corresponding element of the graphic report and double click. You may also create an auxiliary report by double clicking the element of the graphic report, which you are interested in. The type of the original report defines the type of the auxiliary report.
After you have viewed the auxiliary report, press Close to get back to the original report.
Custom reports
Custom reports allow saving often-used reports and its customized settings. For example, you can save different settings for the same report type and run it immediately, without the need to customize it first. This function saves all the settings except a date period and currency.
To save a report, click Customize tab, edit the report’s filter, click Save button and select the Save report settings menu. To change a custom report's filter, open it, edit the filter and click Save.